The search market has always been competitive, with many advertisers competing for the same high-value audiences, and they’re willing to pay for it. But the past year brought a level of change few organisations were fully prepared for. Click prices rose, tracking became more complex, and Google released a series of new AI products that quietly changed how people search and how advertisers appear.

Performance Marketing Consultant
For organizations where margins are tight and regulations are strict, these shifts were felt immediately. But despite these challenges, we found something encouraging:
It’s still possible to stay profitable, even when the search market changes fast. In the following case, cost per click dropped by over 13% while total traffic increased, all within the same budget. The key was, adapting early and keeping control of data.
This blog shares how we supported a client in one of the most complex verticals, and what other organisations can learn to stay profitable in a changing search market.
What’s changing in the Search Market
Three major changes hit at the same time, reshaping everything from targeting to cost:
1. Stricter cookie rules
Tracking became less reliable across devices and channels, making it harder to understand how users move, reducing attribution accuracy, and increasing the cost of reaching the right audiences.
2. More advertisers entering auctions
More advertisers entered the same auctions, pushing click prices up, especially on core high-intent keywords.
3. Google’s new AI products
Performance Max, AI Overviews, SGE, AI Mode, and AI Max have all changed how search results are generated and how ads are matched to queries.
And one trend stood out:
Brand clicks became more expensive, in some cases around 12% higher, because automated systems can place competitors into brand auctions without anyone realizing.
In other words: Advertisers now need more deliberate optimization to maintain the visibility they already had
The performance challenge
With rising click prices, especially on brand terms, the main goal became clear:
Reduce cost per click without compromising traffic quality or losing visibility.
To do this, we needed to rethink how budgets were structured, particularly between brand and generic keywords. The strongest opportunity for improvement still sit within generic search, when campaigns are set up with precision.
How AI is actually changing Search behaviour
Many believed AI tools would immediately reduce organic and paid search traffic. To find out what was really happening, we analysed data across industries and aligned traffic trends with major AI release timelines. The results surprised us:
- There was no clear, universal drop in search traffic tied directly to AI.
- Instead, small shifts appeared across paid and organic, indicating a more nuanced change in user behaviour.
- AI is becoming a new discovery layer, not a full replacement for search.
This makes it even more important for brands to track AI-driven traffic separately and understand how those users behave differently once they land on the website.
Why we chose not to use Performance Max or AI Max
A central decision in this case was opting out of Google’s fully automated AI campaign formats.
This decision was based on three principles:
1. Protect customer data
AI-driven formats often require sharing more first-party data with Google.
For companies with strict privacy requirements, this is not an option.
2. Keep full transparency
Performance Max and similar formats limit insight into:
Which queries triggered ads
How the budget was allocated
Which elements contributed to the results
Without that insight, meaningful optimization becomes difficult.
3. Optimise the full customer journey, not just clicks
Clicks alone don’t tell the full story. We focus on actions that signal real value: form submissions, meeting requests, long-term engagement. Those outcomes require a level of control that black-box systems can’t provide.
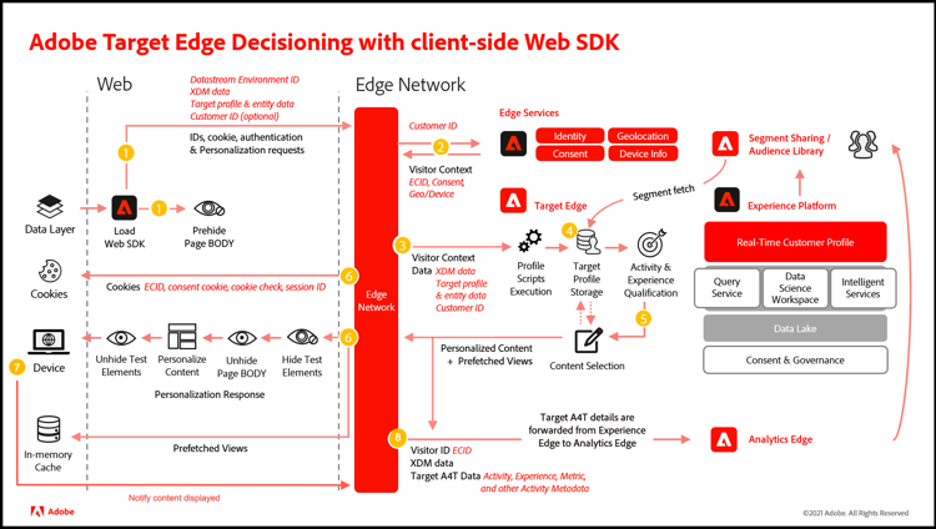
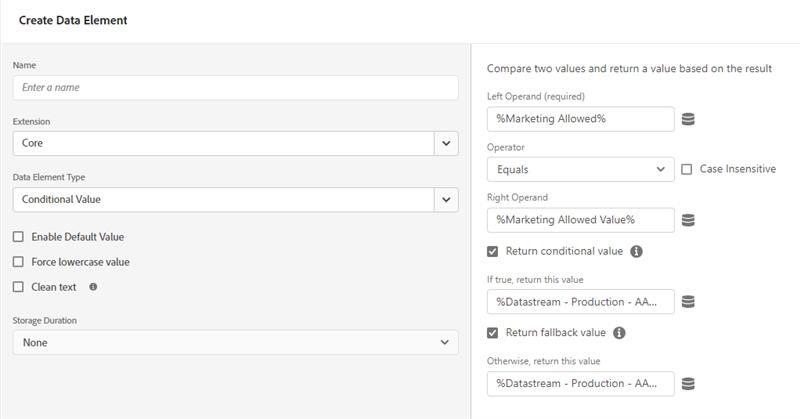
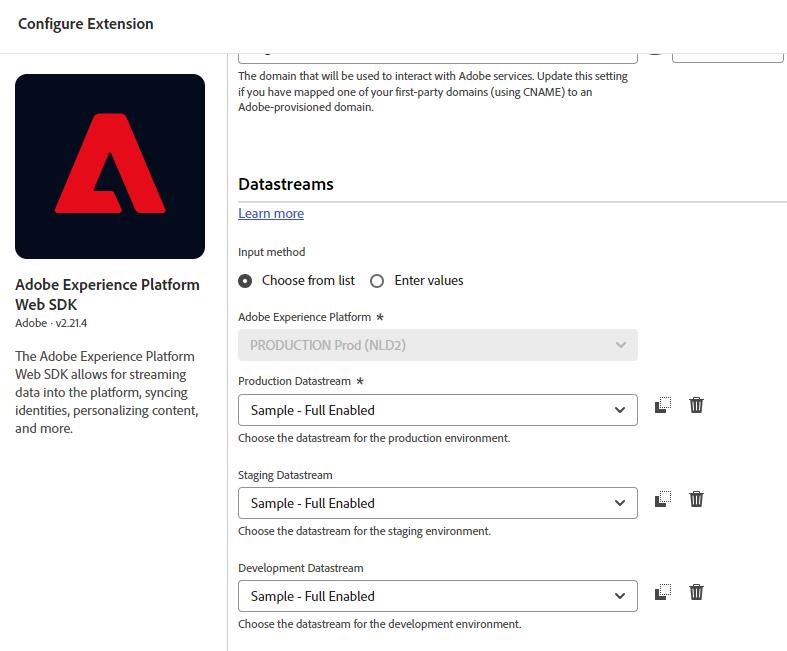
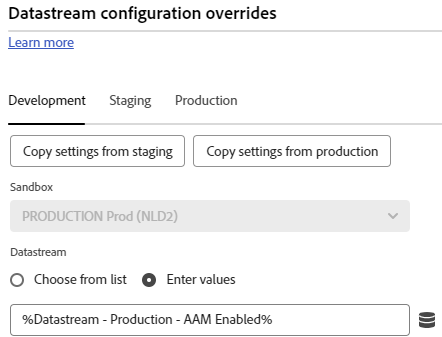
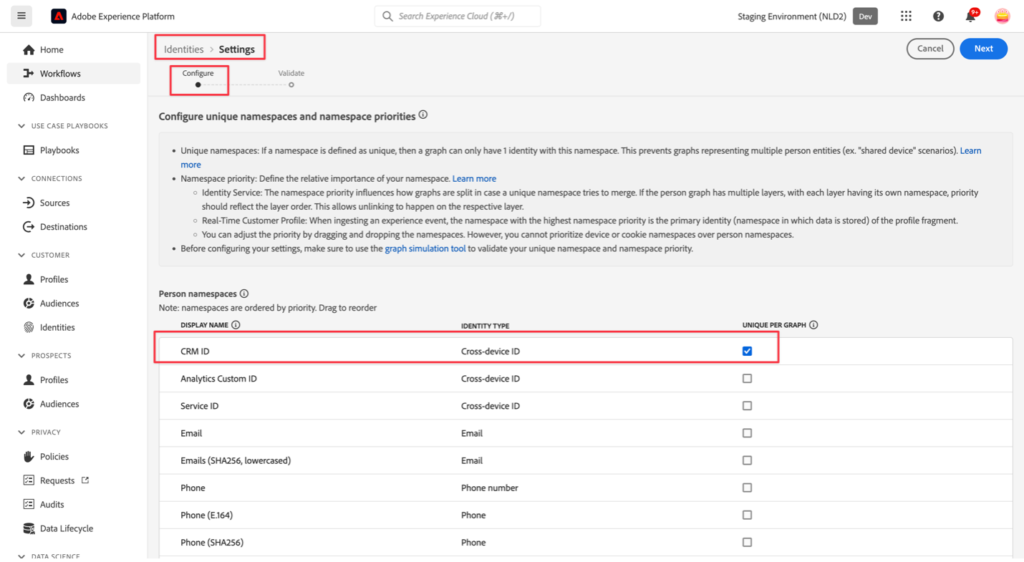
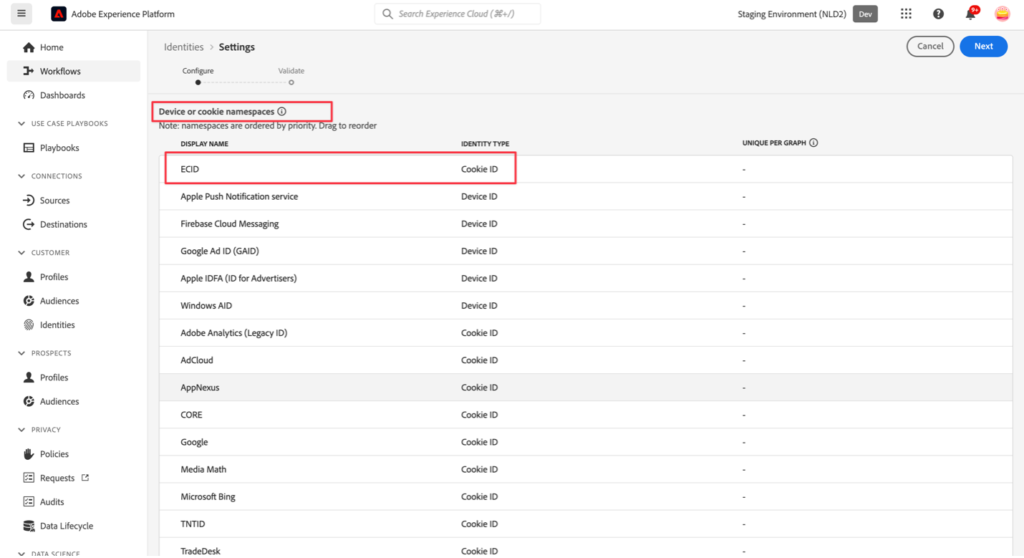
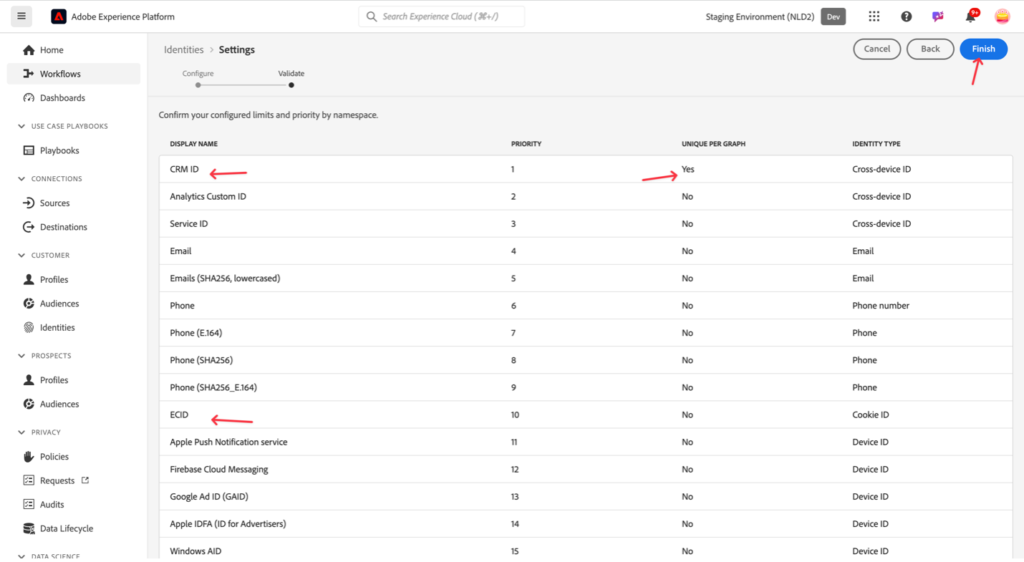
Instead, we use transparent solutions like Adobe Advertising Cloud, where data stays with the organisation and strategies can be shaped around actual business goals.
Keeping the brand strong while improving generic search
When brand CPCs rise, the only sustainable approach is to make generic search more efficient.
Our focus became:
- Maintaining brand visibility
- Reducing CPC in areas where we have optimisation levers
- Improving the performance of mortgage-related generic keywords
This approach allows advertisers to keep their position in a competitive market while balancing rising costs.
What we optimized in Generic Search
Here are a few principles that made a measurable difference:
✔ Clear separation between Phrase Match and Exact Match
This creates stronger control and reduces unnecessary overlaps.
✔ Strategic use of negative keywords
This ensures the right search term triggers the right campaign.
✔ Improved ad relevance
Higher-quality ads mean stronger Quality Scores, which support lower CPC over time.
✔ Smarter bidding with AdCloud portfolios
Here we can bid based on value, not just clicks, and adjust quickly as the market shifts.
✔ Budget reallocation to the most efficient campaigns
We invest where performance is proven, not where platforms suggest automatically.
Individually, these steps seem simple, but together, they create stability in a market that’s becoming harder to predict.
The results:
The results outperformed expectations:
Traffic increased by 9%
Impressions grew by 20.25%
CPC dropped by 13.58%
Total costs decreased by 5.58%
These outcomes show that a controlled, data-led approach can remain effective even as AI reshapes search behaviour and CPC trends.
Preparing for what’s next
Even with strong performance today, the future will demand even more.
The future belongs to brands that build and activate their own first-party data.
As third-party cookies disappear and AI-driven formats expand, relying on platform data alone will only get harder.
First-party data enables:
- More relevant targeting
- Better measurement
- Stronger long-term customer value
- Full ownership and compliance
For example, for banks and other regulated industries, it’s becoming not just an advantage, but a requirement.
Final thoughts
The search market is changing quickly, but the path to profitability is still there. The organizations that succeed will be the ones that:
Stay in control of their data
Use automation thoughtfully
Understand how AI is reshaping behavior
Strengthen their generic search strategy
Build measurement frameworks for long-term value
Those who adapt early and stay transparent in their approach will be well positioned for what comes next.
Ready to stay profitable in a changing Search market?
If you want to understand how your search setup performs under these new conditions, we’re here to help.
Reach out to us for a "Search Efficiency Review" and find out where costs can be reduced and where long-term value can grow.