Do you want to learn how to pinpoint, troubleshoot, and resolve common data issues in the Adobe Web SDK?
In this 20-minute Mini Masterclass, our very own Sampsa Suoninen will walk you through how to spot errors early, resolve them efficiently, and keep your data collection on track.
Why should you watch this Masterclass?
Many organizations are embracing the Adobe Web SDK or migrating from Adobe Analytics (AA) to Customer Journey Analytics (CJA).
When data streams are disrupted, reporting and insights can suffer.
Who should attend?
Developers, analysts, and marketers who use or plan to use the Web SDK.
Teams preparing to migrate from AA to CJA, looking for a seamless data collection process.
What you will learn:
Core concepts: Understand how the Web SDK combines data collection for Analytics, Target, and other Adobe products.
Troubleshooting method: Follow a clear, step-by-step approach to prevent and fix data flow issues.
Essential tools: Learn how to use the Adobe Experience Platform Debugger to track network requests and verify setup.
Data safeguards: Discover ways to record requests and maintain integrity, even when errors occur.
Real-world scenarios: See how other teams tackled common challenges and kept their data flowing.
Who Should Attend?
Developers, analysts, and marketers who use or plan to use the Web SDK.
Teams preparing to migrate from AA to CJA, looking for a seamless data collection process.
Bonus: In the session, you will be able to download a concise PDF checklist outlining the key debugging steps for the Web SDK—your quick reference guide whenever issues arise.
The Adobe Analytics Component Manager by Datacroft is an essential tool for many organizations using Adobe Analytics.
Several of our clients use and benefit from Datacroft's Component Manager. It's a fantastic tool, so a shout-out to Lukas Oldenburg for his work on it.
I strongly recommend you check it out if you're not familiar with it already.
If you are familiar with it, you know it works in Google Sheets, which not all our clients are excited about for various reasons. This has got me thinking that it should be possible to use the Adobe Analytics APIs in Excel.
Kasper Andersen,Partner
Like everyone else, we at Accrease are investigating how we can better use AI internally, with our clients, and in our deliveries.
So, last week, I decided to see how far I could push AI as a developer on something I had yet to gain exposure to. I thought it would be a good project to see if I could integrate the Adobe APIs into Microsoft Excel.
I am by no means a developer. Javascript I can read, but I used to Google it if I needed to write. Nowadays, I GPT it— if that's even a thing?
I use chatGPT daily, from being my personal developer to checking my grammar and summarizing notes. Even talk with it when driving to and from work. I know, I really need to find some friends.
My initial thought was to have chatGPT support me in building an Excel add-on, but after explaining my requirements, it suggested using Office Scripts?!
What are office scripts?
I've had no previous exposure to Office Scripts, so if you're the same, let me give you a quick intro to them.
Office Scripts is a tool in Microsoft Excel that helps you automate repetitive tasks. It makes it easy for everyone to use, even if you don't know how to code. Excel even comes with some out-of-the-box scripts to make your life easier. You can either record an action for it or code it using TypeScript, which is basically JavaScript.
They are only available in Office 365, but you can share them across users and organizations.
Now, you might be thinking. What's the difference between Office Scripts and traditional Excel Macros? Office Scripts are newer and easier to use than older Excel macros. Macros use a language called VBA, but Office Scripts uses TypeScript/JavaScript. Office Scripts also work with the online version of Excel, making them more convenient for using different devices.
Whether I've piqued your interest or not, if you're working in Excel daily, you should do yourself a favor and watch a few YouTube videos on the topic.
The result
It took about a week—a lot of back-and-forth with chatGPT and tests in Postman (for the Analytics APIs) and copy-pasting the office scripts. Whenever Excel generated an error, I would paste the error message back into chatGPT, asking it to address the error and creating a new script.
Once I had a functioning script, I would ask chatGPT to optimize it without breaking its functionality, which often resulted in a much smaller script.
I'm pretty impressed by the results myself and how AI can function as a developer — I have no real previous experience with the APIs and certainly not with Office Scripts, and today, we have a spreadsheet that works both on the desktop and online version of Excel.
For now, the functionality is the following:
Extract Workspaces: See usage and edit them straight in the spreadsheet.
Extract users: See their activities broken down by 4 previous quarters.
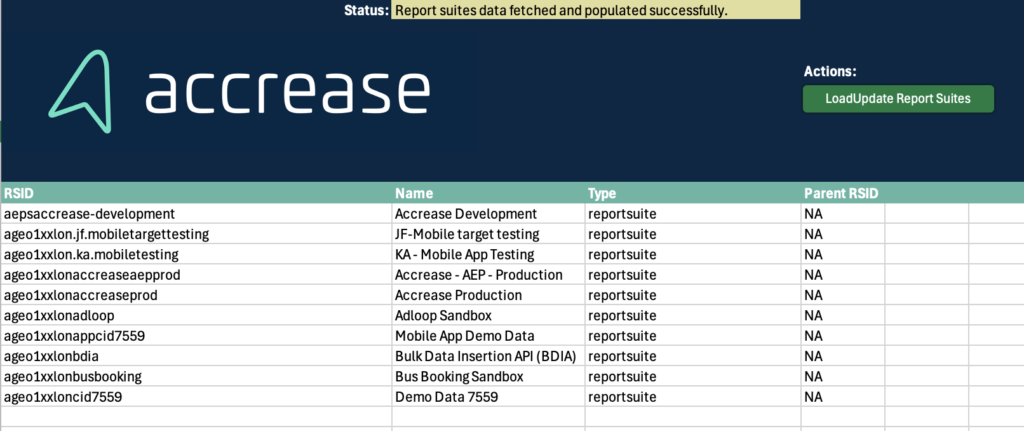
Extract report suites: Provides an overview of your Report Suites and Virtual Report Suites.
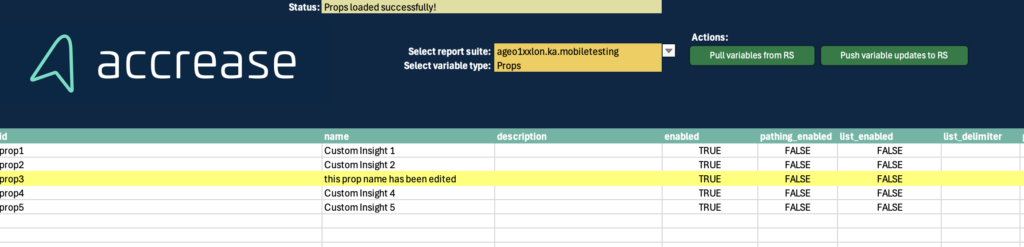
Edit report suites: Allows editing/enabling/disabling variables in one report suite at a time.
Let's get you started
Enough talk; let's get your set up to take it for a spin.
1. Download the sheet
Start by downloading the sheet by filling out the form below:
2. Configure API connection
Once you have the sheet, the first step is to go to the config tab. You must fill out A11 (Client ID) and C11 (Access Token).
To get this information, you need to create a project on Adobe.io. Here are the high-level steps:
Create a new project.
Click add API.
Select Adobe Analytics.
Select OAuth Server-to-Server.
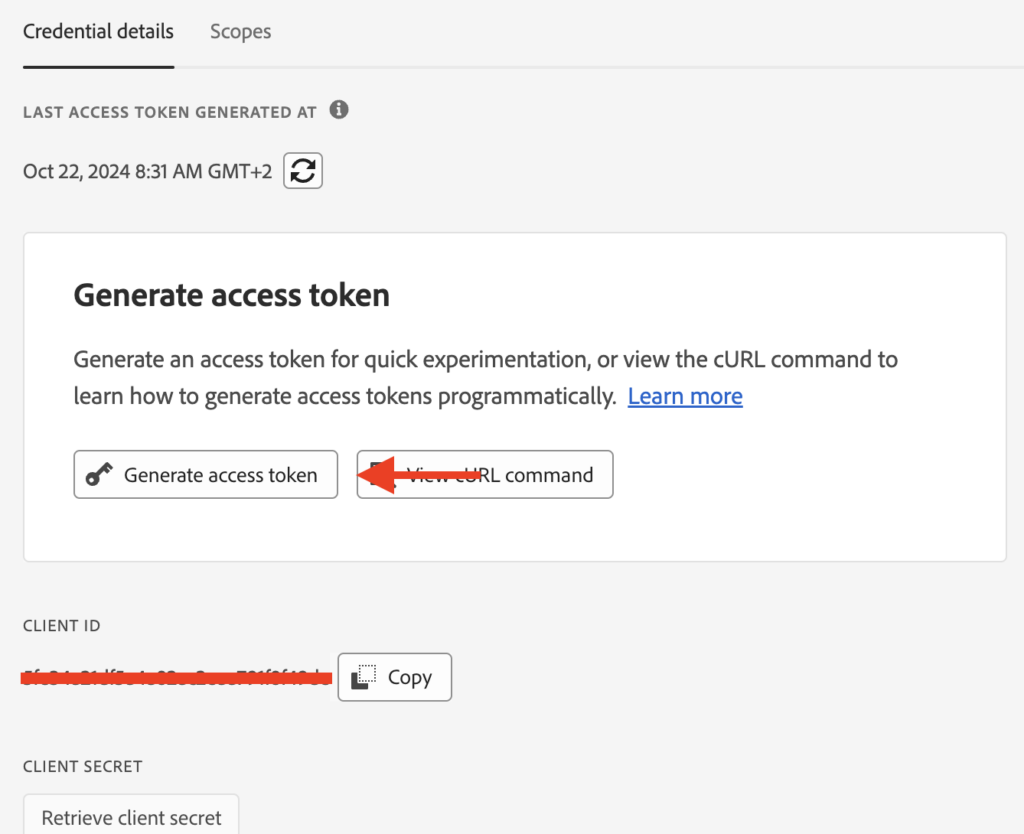
Once the project is created you can find the credentials on the Project Overview page under Credentials.
Copy and paste them into the cells, and click the button, Get OrgId.
If successful, B11 will be populated with your Global Company ID, and you will be ready to use the other sheets.
IMPORTANT: Be aware that the sheet is not automatically getting the access token; why you just copied and pasted it. This also means that it expires after 24 hours. If that happens, you'll get an error when using the spreadsheet. All you have to do is go to your Project Overview > Credentials and click Generate new Access Token, which you copy and paste into the sheet again.
3. Start using the sheet
Hopefully, the buttons are self-explanatory. The Pull- buttons will extract and fill the sheet. You cannot mess anything up if you don't click the Push- buttons, as this will push changes back into Analytics. But let's quickly go through the sheets:
Report Suite: Start here, as it functions as the source for the dropdown in the Report Suite Editor sheet. Other than that, it only has the purpose of giving you an overview of your report suites.
Report Suite Editor: Select your report suites from the dropdown along with the variable type you wish to load. Click the pull button, and they will load. If you make any edits, the row will be highlighted in yellow - if you edit it back to its original value, it will still be highlighted. So, to 'reset' the sheet, you click the pull button again. Edits will populate the last column with a 'True.' Clicking the Push button will push all rows marked with True back into Adobe Analytics. After the push, you should click the Pull button to refresh and see your updates have been applied.
Users: The purpose of this sheet is to provide an overview of the users and how often they log in. Besides giving a general overview over the past 4 quarters, it will also provide an overview of users who have not logged in the last 12 and 3 months. Please note: The user's list is pulled from within Adobe Analytics (Admin > Analytics Users & Assets). It will not correspond with the list of users from within the Product Profiles in the Admin Console.
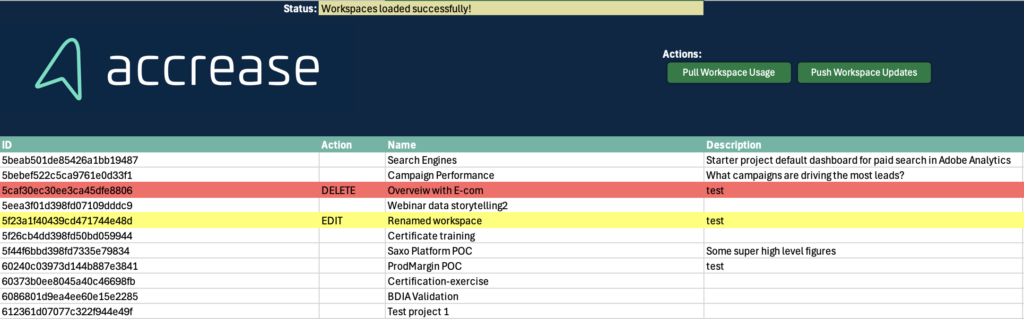
Workspaces: This sheet allows you to pull all the workspaces in the account with all the details required to understand when it was created, which report suite it is used on, who created it, etc. You can delete and make edits to the workspaces.
If you edit details for a workspace, e.g., change its name, the row will be marked yellow, and column B (Action) will be pre-populated with EDIT.
If you want to delete a workspace, click the cell in column B (Action) and select DELETE. This will mark the row with red, indicating it will be deleted. If you remove the DELETE value or redo any edits to the original value, it will still be highlighted; you can pull data again to reset.
If you make any edits, the 'Action' column will have a value, and the rows will be highlighted in color. Based on this, the API will push updates for all workspaces with an EDIT or DELETE value set.
After the push, you should hit the pull button to see the updates to the Workspaces.
Final note
You are responsible for using this tool, and Accrease is not liable for any outcomes resulting from its use.
The sheet uses macros, which you should enable. Macros look for edits and highlight the row that is edited. I could not get this working with Office Scripts.
Remember, it requires a work/school account with Microsoft 365, as Office Scripts are unavailable on personal accounts.
Feel free to copy the Office Scripts if you can use them elsewhere.
I'd love to hear your thoughts!
Please comment below if you found this helpful or have suggestions for additional features. We'll continue to expand on the features based on the input we receive.
What if you could pinpoint your most engaged users, understand what makes them tick, and tailor your strategies to boost conversions and retention?
In this webinar, our very own Jude Felix, Data Scientist at Accrease will show you how to activate an engagement score and drive significant business impact. Discover how engagement scoring can turn your customer data into actionable insights that fuel growth and improve outcomes.
Here's what you can expect:
How Can Engagement Scoring Impact Your Business? Understand why engagement scoring matters and how it directly contributes to driving meaningful results for your business.
Introduction to Engagement Scoring: Learn what engagement scoring is, its role in analytics, and why it's crucial for effective decision-making.
Role of Adobe Analytics & Customer Journey Analytics: Compare key features and benefits of Adobe Analytics (AA) and Customer Journey Analytics (CJA), and understand how these tools help bring engagement scoring to life.
Data Requirements: Identify relevant data sources, understand the types of data needed, and address data quality and integration challenges.
Building Your Engagement Scoring Model: Learn the steps to define key metrics, collect data, develop, and validate an effective engagement scoring model.
Implementing and Activating the Model: Discover how to integrate your engagement scoring model into AA and CJA, and how to monitor and adjust it for maximum impact.
Takeaways
Bonus: As an added bonus, all attendees will receive a complimentary pre-counseling offer! This includes a free one-on-one consulting session with Jude to help you get started. This offer is for those who use Adobe Analytics and are ready to activate their data for engagement scoring.
What if you could pinpoint your most engaged users, understand what makes them tick, and tailor your strategies to boost conversions and retention? With Adobe Analytics (AA) and Adobe Customer Journey Analytics (CJA), you already have a wealth of data on user behaviour. The real challenge lies in distilling that data into clear, actionable insights.
An Engagement Scoring Model helps you do just that. By assigning scores based on user interactions, you’ll quickly identify your top-performing audience segments, understand which behaviours drive the most value, and prioritize efforts to maximize business outcomes.
In this guide, Jude Felix, Senior Consultant at Accrease will show you how to build an Engagement Scoring Model step by step. You’ll learn how to transform raw analytics data into a powerful tool for targeting, personalization, and optimization, giving you a clearer view of what drives success—and how to replicate it.
Jude Felix,Senior Consultant
What is an Engagement Scoring Model?
An Engagement Scoring Model is a framework that assigns a numerical score to users based on their interactions with your digital properties. By scoring user engagement, you can:
- Identify which user behaviors or interactions are most valuable.
- Segment users based on their engagement levels.
- Make data-driven decisions for targeting, personalization, and optimization.
The process for creating this model combines both gut-based intuition and data-driven analysis to determine which metrics matter most for your business goals. Below are the steps to make the model.
Steps to create the Engagement Scoring Model
Creating an effective engagement scoring model is a powerful way to understand and quantify user behavior. It helps businesses tailor strategies and drive more meaningful customer interactions. Following a structured approach, you can identify key engagement metrics, analyze their impact, and assign appropriate weights to create a robust scoring system.
In this process, we will walk through 7 key steps, starting with defining the data timeframe, selecting relevant metrics, and conducting correlation analysis. We’ll then benchmark metrics, assign weights, and create an engagement score formula. Finally, we validate the model to ensure it accurately reflects user engagement and drives real business results. This systematic approach helps you gauge engagement effectively and provides actionable insights to refine customer experience and strategy for better outcomes.
1. Decide the data time frame
The first step is to decide how much data you want to include in your model. The last 30 days is typically a good starting point, as they capture recent user behaviour without including too much stale data. However, depending on your business or campaign needs, you may choose a different timeframe (e.g., last 7 days or last 90 days).
2. Select key metrics
Selecting the right metrics is the most important step in building the engagement model. There are two main approaches to choosing these metrics:
The intuition-based approach: Based on your experience and knowledge of your customers, you can choose metrics that you believe are important for driving engagement. Some of the metrics might include:
- Page views
- Time spent on site
- Number of sessions
- Product views
- Purchases
- Revenue
The data-driven approach: If you want a more empirical approach, you can identify the metrics most correlated with achieving a specific goal, such as purchasing or signing up for a newsletter. You can do this through statistical correlation analysis, which we will discuss in the next step.
3. Perform Correlation Analysis
To validate and refine the chosen metrics, you can use statistical methods to find out which ones are most closely associated with user success or your defined goals. The goal here is to understand which metrics have the greatest impact on user engagement.
How do you conduct the correlation analysis in Excel?
Gather your data:
- Export relevant data from AA or CJA for your selected metrics over your chosen timeframe (e.g., the last 30 days).
Enable Analysis Toolpak in Excel:
- Go to File > Options > Add-ins.
- In the Manage box, select Excel Add-ins, and click Go.
- Check the box for Analysis Toolpak, and click OK.
Run the correlation analysis:
- Organize your data in columns, with each column representing a metric.
- Navigate to Data > Data Analysis and choose Correlation.
- Select the range of data and choose Output Range to display the correlation matrix.
Analyze the results:
- The correlation matrix will show you the correlation coefficients between each metric and the goal metric (e.g., purchases, signups).
- A correlation coefficient ranges from -1 to 1, with 1 indicating a perfect positive correlation, -1 indicating a perfect negative correlation, and 0 indicating no correlation.
Figure 1 below shows the results of a correlation calculation in Excel based on a few selected metrics.
Figure 1 Correlation calculation in Excel.
4. Benchmark a Score Using the Correlation Coefficients
Once you have your correlation coefficients, the next step is to decide which metrics to include in your engagement model. To do this, you can benchmark a threshold score by calculating the average correlation coefficient across all metrics.
- Metrics with correlation coefficients equal to or above the average should be included in the engagement model.
- Metrics below the average threshold may not significantly contribute to engagement and can be excluded.
Based on the coefficients of correlation from the Figure 1 we can create a benchmark chart like in Figure 2. The metrics number 3, 5, 6, 7 and 8 are he metrics that is highly correlated.
Figure 2 Benchmark chart
5. Assign weights to the metrics
Now that you have selected the most relevant metrics, you need to assign them weights. These weights determine how much influence each metric will have on the overall engagement score.
Normalizing Correlation Coefficients to Assign Weights:
Take the correlation coefficients from the previous step and normalize them so that they add up to 100%. This can be done by dividing each metric’s correlation coefficient by the total sum of all selected metrics’ correlation coefficients and multiplying by 100.
For example, if you have three metrics with correlation coefficients of 0.8, 0.5, and 0.3, you can calculate the normalized weights as follows:
These normalized values become the weights for each metric, ensuring that the metrics most closely associated with user engagement have the greatest impact on the score.
6. Create the Engagement Score Formula
Now that you have both the metrics and their respective weights, you can calculate the engagement score for each user. The formula will look something like this:
For example, if you score based on Page Views, Time Spent on Site, and Purchases, figure 3 shows how this can be created in AA or CJA.
Figure 3 Calculation of engagement score
7. Validate the Engagement Model
After building the engagement scoring model, it’s crucial to validate it by applying the model to a sample of users and comparing the scores with actual business outcomes. As shown in figure 3, we can Do higher engagement scores correlate with higher conversions or more purchases?
If the scores don’t align with real-world outcomes, you may need to revisit the metrics or re-run the correlation analysis to fine-tune the model.
If the model accurately reflects user engagement and correlates with success, it’s ready to be deployed.
Why use an Engagement Scoring Model?
An engagement scoring model provides businesses a tangible way to measure and track user engagement over time. Here’s why it matters:
Identify high-value users: By scoring users, you can quickly identify your most engaged users, allowing you to focus your marketing efforts where they’ll have the greatest impact.
Target personalization: Use engagement scores to deliver personalized experiences based on the level of user engagement, creating a more tailored and relevant experience for your audience.
Optimize user journeys: By understanding which behaviors drive engagement, you can optimize your website, app, or marketing efforts to encourage those behaviours, improving overall customer satisfaction and conversion rates.
Conclusion
Building an engagement scoring model using Adobe Analytics or Customer Journey Analytics data is a powerful way to turn raw user interaction data into actionable insights. By following a data-driven approach backed by statistical analysis, you can create a model that accurately reflects user engagement and drives better business outcomes.
This method combines both intuition and rigorous analysis, ensuring that the metrics you choose are grounded in actual data and that the engagement scores you generate align with your business goals. Whether you’re focusing on retention, acquisition, or conversion optimization, an engagement scoring model provides the foundation for smarter, more effective marketing and product strategies.
Start building your model today to maximize your Adobe Analytics data.
Want to dive deeper? Join Jude Felix for a 20-minute Mini Masterclass: 'How to Activate Engagement Scoring to Drive Business Impact.' In this session, Jude will walk you through building and activating engagement scoring models using Adobe Analytics and Customer Journey Analytics (CJA). Don't miss out, sign up here: Mini Masterclass
If you work in digital marketing, you cannot avoid having been exposed to conversations about how a CDP fixes most, if not all, of your problems. For companies who have bought into the Adobe stack, you'll likely be looking at Adobe RTCDP.
A CDP isn't an impulse purchase (if such a thing exists in Marketing) but is often a long process. However, this shouldn't put you in a waiting position. If you have Adobe Target, you can start your CDP journey today and harvest some low-hanging fruits. If you need to consider a CDP, then using Target can help you build a business case for why purchasing one is valid.
Kasper Andersen, Partner
In this article, you will learn how Adobe Target can work like a Customer Data Platform (CDP), its good and bad parts, and how it can help you move towards using a complete CDP. This guide will show easy steps to help you get started.
Can Adobe Target Work as a CDP?
Adobe Target has many features similar to those of a real CDP. This means it can be a good choice for businesses that want to use customer data to make things more personal without paying for a full CDP. However, there are some differences between Adobe Target and a real CDP.
A traditional CDP collects data from many sources, such as websites, emails, and in-store purchases, and combines it with ID stitching to create a complete picture of each customer. Adobe Target, however, doesn't have the same advanced ID stitching and is primarily intended for testing and improving experiences. Adobe Target can collect and use customer data, but it only has some tools a real CDP has to gather data from many sources.
Still, Adobe Target does have some CDP-like functions when used with Adobe Experience Cloud. Customer Attributes can bring in offline data like purchase history and CRM data. For example, Adobe Target can use information from a CRM to suggest products that customers might like. This can help create a consistent experience across all channels.
Adobe Target is good at combining customer data to create groups and personalize messages, just like a CDP. However, personalization will be on a group level rather than the 1:1 personalization a CDP can deliver.
How Adobe Target Collects Data
Adobe Target has some tools that help collect and organize customer data. When a visitor visits your site, Target creates a Profile based on the cookie ID and 'stores' information in the Profile that you tell it to.
This is done using mbox profile parameters.
This is great for returning visitors, as you can now personalize and promote messages based on the visitor's previous behavior.
Personalization goes wrong when the same visitor accesses the site from a new device. A new device means a new cookie and a new Target profile.
Target has a fix for that.
If your visitors are logging in, you can pass a DeclaredID to Adobe's Visitor ID Service or through a mbox parameter named mbox3rdPartyId.
When mbox3rdPartyId (or the Visitor ID Service) is set, it stitches the cookie IDs across devices to ensure that the Profile stays the same across devices.
Now, it begins getting interesting as Target begins behaving like a CDP.
One key feature available when setting the DeclaredID is using Customer Attributes. This lets Adobe Target collect data from CRM, Call centers, and other sources all in one place. For example, a business can use Adobe Target to target customers who are evaluated as having a high churn risk and use that information to show a relevant message to reduce the churn.
Adobe Target can also collect data in real time, which helps keep customer profiles up to date. If a customer leaves items in their shopping cart, Adobe Target can offer a discount immediately to help close the sale.
Benefits of Using Adobe Target as a CDP
- Personalized Experiences: Adobe Target allows grouping more significant segments and personalization of them based on their common attributes.
- Real-Time Responses: Adobe Target can react to customer actions instantly. For example, if a user is looking at a specific product, Adobe Target can immediately show them more related products.
- Works with Adobe Tools: Adobe Target works well with other tools like Adobe Analytics. This helps businesses get more information about their customers and use it to improve their marketing.
Challenges of Using Adobe Target as a CDP
Not as Powerful as a Full CDP: Adobe Target has tools different from those of a real CDP, which does not allow one to get a complete view of each customer.
Data Silos: Adobe Target is limited to how much offline data can be onboarded.
ID Stitching: Adobe Target has fundamental ID stitching, which cannot be compared to a real CDP.
Step-by-Step Guide: Setting Up Adobe Target as a CDP
Overall, there are three steps you need to perform to begin to do cross-device personalization with CRM data.
Pass DeclaredID to Adobe
Configure Customer Attributes (import CRM or other data sources)
Create an Audience off of your newly imported CRM data
Pass DeclaredID to Adobe
As mentioned, this can be done using Visitor ID Service and the mbox parameter mbox3rdPartyId. I'll only walk you through the simplest of the two, the mbox3rdPartyId approach.
Ideally, your visitor's DeclaredID is already exposed in your data layer when users log in. If not, your IT department might have to expose it for you.
I'm also assuming you're using Adobe Tags (aka. Adobe Launch) as your Tag Manager solution and already know how it works regarding libraries and publishing flows. Here goes:
1. Create a data element for the DeclaredID (if it doesn't already exist) and map it to your data layer element. For me, it looks like this:
2. You may already have an existing rule that triggers Target on all pages. You can edit this or create a new one.
3. In your actions of the rule, add or click on the existing Adobe Target - Add Params to All Requests.
4. Add a new parameter mapped to the data element in step 1. Make sure the parameter name is spelled correctly. Otherwise, it won't function as expected.
5. Publish your new changes.
Technically, you're done now.
By deploying the mbox3rdPartyId, you can now do cross-device personalization, as Target will now ID sti...or rather, cookie stitch visitors with a DeclaredID. Of course, the visitor must log in on both devices for Target to stitch.
Your segmentation is still limited to behavior collected by Target, so let's move on to ensure you can segment on offline/CRM data.
Configure Customer Attributes
Customer Attributes allows you to import offline data and tie it to the DeclaredID. Any offline data you can map to the DeclaredID can be uploaded into Customer Attributes, and by doing so, it becomes available to create Audiences in Adobe Target.
Data points examples:
- Membership level/type
- Membership points
- Next best offers
- Next best action
- Churn risk
- Customer Lifetime Value
- Lead score
- etc.
Before you start, ensure you know what data you want to upload and that the data can be mapped to the DeclaredID set on your site. Once you have that, you can get started with configuring the Customer Attributes:
1. Navigate to People
2. Navigate to Customer Attributes in the top menu.
3. Click +New
4. Creating the new Customer Attribute is pretty straightforward. The most important field is the Alias ID. When taking the mbox3rdPartyId approach, you can give it any name. If you've taken the Visitor ID Service, it is important that the alias matches the alias you've set in the implementation.
5. Upload your file with the data and confirm the schema. Ensure that the first column contains the DeclaredID.
6. Finally, activate the Customer Attribute for Target.
Depending on your Target license, you might be limited to activating only three columns at a time.
More importantly, you can automate the file upload. You could do this via your Marketing Automation tool (e.g., Adobe Campaign, Marketo, or something else).
The benefit here is that you—in most cases—already have your CRM data integrated into these solutions. So, instead of creating a new integration, you benefit from having your Marketing Automation spit out a daily, weekly, and monthly file that Customer Attributes then pick up and load to ensure your data is kept up to date.
Create an Audience with your new onboarded data
If you've been able to follow along this far, then it is time to be excited, as this is where the fun begins.
When creating a new Audience, you should select Visitor Profile. Here, your Customer Attribute will be auto-populated with the data columns that you activated.
It is simply going crazy building Audiences and using them in your activities.
Let's recap what you've achieved so far:
- You're setting a DeclaredID for your visitors who log in. This allows you to A/B test and personalize cross-device.
You've enabled and activated a Customer Attribute that imports offline data, allowing you to build segments on this data — a classic use case for why to invest in a CDP.
Recap of the benefits of using Adobe Target as a CDP
- Works with Adobe Tools: Adobe Target works well with Adobe Analytics and other products.
- Real-Time Personalization: It uses real-time data to give personalized content right away.
- Prepare for a CDP: Investing in a CDP involves getting teams together. You can slowly kickstart that process and even build a business case for why an investment in a CDP makes sense for your business.
- Eager Businesses: It's suitable for companies who wants to move NOW and cannot wait for when budget is available.
- Keep in mind that Adobe Target is not a CDP. However, it can be a great place to start for most companies considering a CDP but are struggling to build a proper business case or if you want to take your personalization program to the next level.
Conclusion: Is Adobe Target a Good CDP for You?
Adobe Target is a good option if you want to start creating personalized experiences for your customers without a complete CDP. It has tools for using customer data, creating audience groups, and providing real-time customized content. Adobe Target also works well with other Adobe tools, which makes it a good choice for many businesses.
If you are starting with personalization or already using Adobe products, Adobe Target can help you get many of the benefits of a CDP without the high cost. It's beneficial for smaller businesses that want to use customer data to improve the customer journey.
If you want to learn more about Adobe Target as a CDP or how other Adobe tools can help you use your customer data better, contact us! We'd love to hear from you. Leave a comment or share this post if you found it helpful!
Tracking how much of a webpage users actually view is crucial to understanding engagement with your content. Whether you’re analyzing long-form articles, product pages, or campaign landing pages, scroll depth provides direct insight into how far users are going before leaving the page.
For years, the getPercentPageViewed plugin has helped marketers track scroll depth in Adobe Analytics. However, with the adoption of Adobe's new WebSDK, the old plugin is no longer compatible, leaving organizations that rely on modern architectures with a gap in their analytics setup.
We’ve developed a new scroll depth plugin specifically for Adobe’s WebSDK, offering a more robust, flexible, and scalable solution for tracking user engagement. In this post, we’ll explain the problem with the legacy plugin, demonstrate how to visualize scroll depth data, and guide you through the implementation of the new WebSDK-based solution
How to use scroll depth data in Adobe Analytics to identify drop-off points
One of the most valuable insights scroll depth tracking offers is identifying where users drop off on your pages. For landing pages and key CTA pages, this is critical, as it reveals whether visitors are engaging with your content long enough to reach the main calls to action.
Pinpointing drop-off points
Scroll depth data allows you to see exactly how far down the page users scroll before they exit or lose interest. If a significant portion of your visitors drop off before reaching the key messaging or CTA, this indicates a potential issue in your content flow, page design, or CTA placement. By identifying these drop-off points, you can take action to reduce friction and keep users engaged.
Consider screen size: percentages vs. absolute values
When analyzing scroll depth, it’s important to take screen size into account. Users on mobile devices may experience your page differently from desktop users, as content is displayed in a more compressed format. For this reason, it’s often helpful to measure scroll depth both in percentage terms (how far down the page they’ve scrolled) and absolute values(such as pixels or viewport units).
Percentage-based tracking: This helps normalize data across devices, making it easier to see the relative point where users drop off, regardless of screen size. For example, if 50% of mobile and desktop users are dropping off at around the same percentage mark, this provides a clear signal about engagement issues.
Absolute value tracking: This gives you more granular control over understanding specific user behaviors, especially when dealing with longer pages or dynamic content that may load differently across devices.
Mobile vs. non-mobile device analysis
Analyzing scroll depth data separately for mobile and non-mobile (desktop or tablet) devices is crucial for understanding the full picture. Given the different user behaviors and screen sizes, you may find that mobile users drop off sooner due to the nature of scrolling on smaller screens, while desktop users may scroll further before disengaging.
By segmenting your data, you can:
Mobile devices: Adjust content and CTA placement to ensure critical information is visible early on smaller screens, where users typically scroll faster.
Non-mobile devices: For desktops or larger screens, you may have more flexibility in content layout, allowing for CTAs to be placed further down the page, provided engagement levels remain high.
Example: improving CTA engagement on a landing Page
Imagine you’re running a campaign with a dedicated landing page designed to collect sign-ups. After reviewing the scroll depth data segmented by device type, you notice that the majority of mobile users drop off at 20%, while desktop users continue scrolling to 37%, but your sign-up form and CTA button are placed at 70%.
By moving the form higher, say around the 15% mark for mobile users and 35% for desktop users, you ensure that more visitors see the CTA before they drop off. This significantly increases the likelihood of conversions across both device types. Scroll depth tracking helps you make these data-driven adjustments, optimizing the performance of your landing pages for all users.
How to Implement the NewScroll Depth Plugin in Adobe WebSDK
Now that we've covered how scroll depth data helps identify drop-off points and optimize your landing pages, let’s look at how to implement the new plugin in Adobe WebSDK.
Step 1: Add the following code snippet at the end of the "send event" action in your page view rule:
//clear previous page data

_satellite.cookie.remove('initialPercent');

_satellite.cookie.remove('highestPercent');

// Function to set a cookie with an optional expiration in minutes

function setCookie(name, value, minutes) {

    var expires = "";

    if (minutes) {

        var date = new Date();

        date.setTime(date.getTime() + (minutes * 60 * 1000));

        expires = "; expires=" + date.toUTCString();

    }

    document.cookie = name + "=" + (value || "") + expires + "; path=/";

}

// Function to calculate the percentage of the page viewed

function getScrollPercent() {

    const scrollTop = window.pageYOffset || document.documentElement.scrollTop;

    const scrollHeight = document.documentElement.scrollHeight - document.documentElement.clientHeight;

    return Math.min(Math.round((scrollTop / scrollHeight) * 100), 100);

}

// Function to calculate the initial viewport percentage

function getInitialViewportPercent() {

    const viewportHeight = window.innerHeight || document.documentElement.clientHeight;

    const scrollHeight = document.documentElement.scrollHeight;

    return Math.min(Math.round((viewportHeight / scrollHeight) * 100), 100);

}

// Function to track page view data

function trackPageViewData() {

    // Set the initial percent viewed on page load

    if (!_satellite.cookie.get('initialPercent')) {

        // Calculate the initial viewport percentage

        const initialPercent = getInitialViewportPercent();

        _satellite.cookie.set('initialPercent',initialPercent);

        _satellite.cookie.set('highestPercent',initialPercent); // initially set with initial percent value, once user scrolls the page it gets updated.

    }

    // Get the current scroll percent

    const currentPercent = getScrollPercent();

    // Update the highest percent viewed

    const storedHighestPercent = parseFloat(_satellite.cookie.get('highestPercent') || 0);

    if (currentPercent > storedHighestPercent) {

       _satellite.cookie.set('highestPercent',currentPercent);

    }

}

// Initialize page view tracking

trackPageViewData();

// Initialize page view tracking

window.addEventListener('scroll', trackPageViewData); // Track on scroll events

window.addEventListener('click', trackPageViewData); // Track on click events
Step 2: Create a data element that reads the initialPercent and highestPercent values from cookies and builds a string:
Step 3: Map the data element to the desired field in the XDM object in the same page view tracking rule.
Step 4: Build your changes in your development and make sure the eVar is captured with the desired value.
Step 5: Create rule-based classifications to separate initial percent and highest percent values into separate dimensions and then create sub classifications to bucket them if needed.
Considerations for scroll depth tracking
Scroll depth tracking offers valuable insights into how users engage with your content, but there are a few important considerations to be aware of when implementing this feature in Adobe WebSDK.
Scroll data isn’t captured for users who bounce
Currently, our scroll depth plugin does not fire if a user bounces, meaning scroll depth data won’t be captured if a visitor leaves the page without interacting further. This could lead to missed insights, especially on high bounce-rate pages.
Testing before implementing to ensure a smooth rollout
Before implementing the scroll depth tracking plugin in a live environment, it's crucial to conduct thorough testing to ensure it works as expected and doesn't introduce any issues that could affect performance or data accuracy.
Maximizing insights with no additional cost
Scroll depth tracking provides invaluable insights into how users engage with your content and where they drop off, especially for landing pages and key CTA sections. However, it’s important to be mindful of factors like server calls, bounce data, and fast-scrolling behavior when implementing this functionality.
If you are looking to capture real-time scroll data or need help optimizing your scroll depth tracking, we’re happy to help. Contact us for guidance on the best approach for your business and to ensure you’re getting the most out of Adobe Analytics while keeping costs and performance in check.
Santosh would be happy to help! Reach out, get started and ask your questions to: [email protected]
Recently, there have been many discussions and articles on Artificial Intelligence (AI), which is an important topic, now changing how many industries operate. We had the chance to talk to Dana Icikzone, Senior Solution Consultant at Adobe, about this and discuss the release of their new AI Assistant within Adobe Experience Platform.
This blog post is built on our interview with Dana, by reading it you´ll learn more details about the AI Assistant within the Adobe Experience Platform: How different roles can benefit, the general business impact, and perhaps most importantly; the trust and privacy of it. You will also gain valuable perspectives, guidance, and recommendations on how to work with and fully utilize it, from an expert’s point of view.
This is just an introduction. If you are interested in diving deeper into this topic, we are constantly creating blog posts, Mini Masterclasses and content deep diving into the most recent AI prompts, trends and impacts. Follow our LinkedIn page and get noticed when we release something new. But first...
What is the AI Assistant?
To briefly introduce you to the AI Assistant - it is a conversational interface powered by generative AI models. It allows users to ask questions and receive answers based on a combination of base models, custom models, decision-making algorithms and business goals. Embedded within the experience platform, it operates across all applications, including the Real-Time Customer Data Platform (RT-CDP), Adobe Journey Optimizer (AJO), and Customer Journey Analytics (CJA).
The AI Assistant is designed to work seamlessly across various applications within the Adobe Experience Platform. This integration ensures that users can have consistent conversations and obtain relevant answers regardless of the specific application they are using. For instance, an RT-CDP user can still get insights based on CJA data, making workflows more efficient.
Some key technical features
The AI Assistant offers several key features that enhance its utility:
Conversational interface: Allows users to interact naturally and obtain quick answers.
Custom models: Tailored to specific customer needs, ensuring data privacy and relevance.
Role-based access control: Ensures that users can only access data they are authorized to view.
Operational insights: Provides actionable insights based on enterprise data.
Knowledge expansion: Helps users expand their understanding of the platform and their roles.
Verifiable layers: Ensures transparency by providing sources and explanations for all data.
How can the AI assistant benefit my role?
Many different departments and roles benefit from the AI Assistant, including, for example, IT teams, data analysts, and the marketing department. Dana highlighted how it can serve as a companion to developing expertise, managing routine tasks, and providing quick answers to workflow-related questions.
"It should be a companion helpig anyone to become kind of an extended expert," she said.
The IT department
As responsible for ensuring data is collected and being assessable, the IT department can utilize the AI Assistant for data exploration, management, insights, and discovery. For example, in automating routine tasks, thereby freeing up time for more strategic activities. The AI Assistant can answer operational questions, such as how often a segment is used or where a schema field is applied, making data management more efficient.
The data analysts
Data analysts are the professionals ensuring data is thoroughly analyzed and interpreted. They can use the AI Assistant to dive deeper into data sets, perform complex queries, and gain insights quickly. The AI Assistant helps in understanding data structures, troubleshooting specific scenarios, and optimizing workflows. It can also assist in finding and analyzing audiences, making data analysis more streamlined and effective.
The marketing department
Marketing teams ensure data is activated and utilized in strategic decisions, and they also benefit significantly from the AI Assistant. For example, by obtaining quick answers to workflow-related questions and troubleshooting issues. It can aid in campaign creation, audience discovery, and optimizing customer journeys. What the AI Assistant does is help filter out information available within the platform. This can support the decisions you make in terms of creating campaigns, making marketing operations both more efficient and effective.
Prompts and usage
Using the AI Assistant effectively involves specific prompting skills. Users can ask knowledge questions, operational insights questions, and troubleshooting queries. For instance, a digital analyst might ask, "How do I build a segment?" or "What is an identity map?" These prompts help users quickly access necessary information without sifting through extensive documentation.
Another practical example Dana shared is the AI assistant's ability to help find specific audiences within a platform. She explains the problem: "Imagine that you would have to go through every single audience, and there might be thousands of different audiences within a platform". Traditionally, managing your audiences would require a lot of time, creating new audiences, often duplicating existing ones. The AI assistant helps avoid these inefficiencies by providing quick access to the necessary information. For instance, it can help a data analyst quickly identify the most relevant audience for a marketing campaign, saving you a lot of time.
Business impact
The AI Assistant impacts businesses by enabling quick access to enterprise data, facilitating knowledge expansion, and automating tasks. This leads to increased productivity, faster campaign creation, and overall improved efficiency. Dana emphasized how "...being more productive, more efficient and faster as a resource, will enhance your operations." The integration of AI in business processes also helps bridge the gap between different roles, making teams more versatile and efficient. For instance, it can help data analysts understand marketing strategies, and vice versa, leading to more comprehensive and effective campaigns.
Increasing productivity: By automating routine tasks and providing quick access to information, the AI Assistant allows employees to focus on more strategic activities. This leads to increased productivity and faster decision-making processes.
Efficiency improvement: The AI Assistant helps in reducing the time and effort required to perform various tasks. Faster campaign creation and efficient data management contribute to overall easier, efficient and enhanced operations.
Enhancing knowledge and expertise: The AI Assistant aids in expanding the knowledge and expertise of employees by providing quick answers to complex questions. This helps in improving product proficiency and role expansion, making employees more versatile and valuable to the organization.
Trust and privacy
Trust and privacy matters are crucial in the implementation of AI as assistants. Dana emphasized that the AI Assistant on the Adobe Experience Platform is built with these considerations heavily in mind. It uses custom models specific to each customer, ensuring that data is never accessed outside the customer's environment. Role-based access controls further ensure that users can only access data they are permitted to see.
Privacy, security, and governance
The AI Assistant was built with privacy, security, and governance at the forefront. Users must be granted permission to interact with the AI Assistant, and role-based access control policies are strictly honored. This ensures that only authorized personnel can access specific data sets and information.
Customer data protection
The AI Assistant is also designed honoring customer data stewardship. Data is not used or shared across customers, and filters can be leveraged to scrub Personally Identifiable Information (PII). All data provided by the AI Assistant comes with verifiable layers, such as source and explanation, ensuring transparency and trust. Importantly, no third-party data is used to provide answers, which further safeguards customer information.
Dana highlighted, "The AI Assistant uses a combination of models, and one is the custom models that are customer-specific, and those models would never be used, or the data would never be accessed outside of that customer."
Verifiable layers
One of the spotlight features of the AI Assistant is the provision of verifiable layers. Users can always verify where the answer comes from, which is crucial for maintaining trust and accuracy. Dana noted, "There's always a source you can verify, where the answer comes from, which is really important within an AI system."
Future of AI
The future of AI serving as assistants is promising, with potential advancements in automating tasks, generating new segments, and even suggesting optimal strategies based on set goals. Dana believes that as technology evolves, it will continue to drive innovation and efficiency in business operations."I think generative AI is probably the biggest game changer for Adobe in the past decade and has an incredible potential for customer experience solutions” she explains.
AI Assistants are transforming how businesses operate by providing quick access to data, enhancing productivity, and ensuring trust and privacy. As Dana highlighted, the technology's impact on various roles and business processes will only grow, making it an indispensable tool in the modern business landscape.
Want to know more? Read more about the AI Assistant at Adobe and join the conversation: Adobe AI Assistant
We are constantly creating more blog posts, Mini Masterclasses, and content diving deep into AI. If you don't want to miss out follow our LinkedIn page here -> Accrease (Partner of the year)
In this Mini Masterclass we have the pleasure to welcome Sanne Vincent, Head of E-commerce & Customer Insights at Saint-Gobain.
Despite being a small team, Saint-Gobain has achieved many digital accomplishments. They have successfully implemented customization and personalization at scale for their high-volume business, both online and in physical stores. They developed an innovative app tailored to their users' needs, launched a highly personalized new website, and been nominated to prestigious awards for their exceptional efforts.
Additionally, they have centralized their customer data using Adobe's Experience Platform, creating the way for comprehensive omnichannel personalization and customer journey mapping. These achievements, among others, mark exciting digital milestones in Saint-Gobain's personalization journey.
In this session, we are fortunate to hear from Sanne, who has been with the company for 16 years and has been instrumental in this journey, their experiences, and the path they followed.
Here's what you can expect:
Saint-Gobain's personalization & customer experience journey: Hear about their journey, from the purchase of Adobe technolgy 13 years ago to the present day, including groundbreaking developments like their app.
The role of data and the right technology: Their implementation of the customer data platform, "The AEP", and how data centralization has enabled omnichannel personalization, customer journeys, and the ability to undertake projects they would otherwise not have been able to do.
Understanding the customer: Having a large and diverse customer base, the importance of personalized service and targeted communication in their strategy.
Advice from Sanne & Saint-Gobain: Gain tips, learnings, and recommendations from their experience.
Sanne's insights and story will for sure give you the tools, and inspire you to transform your own customer experience! Watch it on-demand below.
Adobe Analytics offers a suite of tools that can transform your data into actionable insights. Our mission is to elevate your analytics skills and transform you into a Pro Analyst. To do so, this Mini Masterclass gives you five essential Adobe Analytics tips.
Mastering these techniques will help you improve marketing strategies, make informed decisions, and ultimately drive better business outcomes. Every tip has been carefully selected by our Senior Consultant and expert in the area, Martine Jorgensen.
Here's what you can expect:
1. Conditional formatting: highlighting trends and patterns in large datasets, making it easier to identify significant data points and create segments based on observed patterns.
2. Utilizing histograms: segment data based on specific metrics, such as product views, to visualize data distribution and understand the impact on conversion rates.
3. Scatter plots for product performance: classify products based on metrics like product views, cart additions, and average unit price, helping to quickly assess and improve product performance.
4. Analyzing content depth: Content depth analysis uses the approximate count distinct function to measure user engagement with different types of content, providing insights into popular and underperforming products.
5. Campaign performancetracking: create cumulative metrics and compare current performance with historical data to assess the effectiveness of ongoing campaigns.
Bonus tip: Anomaly Detection: Anomaly detection identifies unexpected trends to help better understand deviations from expected values.
Don’t miss this opportunity to boost your marketing strategy make better data-driven decisions and drive better business outcomes.
Understand the differences between Customer Journey Analytics and Adobe Analytics with our Senior Analytics Consultant Martine Jørgensen
Customer Journey Analytics vs Adobe Analytics Data analysis is crucial for businesses to make informed decisions, and Customer Journey Analytics and Adobe Analytics are two prominent tools that aid in achieving this goal. Although both tools serve the purpose of providing valuable insights, there are key differences between them. In this blog post, we will explore these differences, discuss the benefits of implementing Customer Journey Analytics, examine successful case studies, and dive into the user profiles of both tools.
But first – What is Customer Journey Analytics? Customer Journey Analytics (CJA) has become a hot topic lately – and understandably. It is a powerful tool for businesses to track, analyze, and optimize customer interactions online and offline. It visualizes the entire journey from awareness to advocacy, helping identify pain points and preferences. By creating detailed customer personas, businesses tailor marketing and products accordingly. Businesses can use these insights to enhance marketing effectiveness, optimize resources, and create a seamless customer experience. It looks a lot like Adobe Analytics in relation to the UI and offers many of the same functionalities – so what’s all the hype about? Although it looks a lot like Adobe Analytics in terms of UI and functionality, there are fundamental differences between the two tools that we will discuss later.
What is Adobe Analytics? Adobe Analytics is the more widely used web analytics tool that focuses primarily on tracking and analyzing website performance. It provides businesses with valuable insights into website traffic, user engagement, conversion rates, and other website-related metrics. Users can create reports with tables and data visualizations in a workspace to analyze and distribute insights.
Adobe Analytics offers a wide range of features, including real-time tracking, segmentation, data visualization, and reporting. It enables businesses to understand how users are interacting with their websites, identify the most effective marketing channels, and optimize website experiences to drive conversions.
What are the Key Differences Between Customer Journey Analytics and Adobe Analytics? As mentioned above, Customer Journey Analytics and Adobe Analytics differ in various aspects. Below are the most essential differences:
The data approach One fundamental difference is their approach to the breadth of data – meaning the variety of data sources. Customer Journey Analytics focuses on capturing and analyzing the entire customer journey, from the initial touchpoint to conversion and beyond. This comprehensive approach allows businesses to gain insights into the various touchpoints and interactions that lead to a conversion, providing a holistic view of the customer's experience. However, Adobe Analytics mainly concentrates on measuring website traffic and engagement metrics, providing valuable information on user behavior within the digital space.
Connect to any data source on the Adobe Experience Platform (AEP) for cross-channel analysis. It is essentially a analysis workspace sitting on top of the AEP whereas Adobe Analytics is an analysis workspace on top of an Adobe Analytics implementation – specifically designed for collecting data within the digital realm. In CJA, instead of report suites in the workspace panels, you will see “data views”. This is your ‘view’ into the data connection that you or other admin users have created containing relevant data sources stitched together. Data views are like virtual report suites. Here you can work with the data, create derived fields, classify values etc.
The Architecture Thus, the architecture looks different for CJA and Adobe Analytics. CJA leverages the technologies of AEP. Here, data collection can come from various sources such as through Adobe's SDK, other Adobe solutions, third-party tools and more. The data is received in the AEP through streaming or batch files. Then, data is organized into a unified set of schemas and cataloged in the Experience Data Model (XDM) which enables a consistent view of the data. To get data from AEP to CJA, one must create a data connection in CJA. When CJA accesses the data lake in the AEP, it essentially pulls a copy into CJA. Then data from the data connection can be curated into a single data view. So CJA can be seen as an extension of the AEP – an analytics interface builds on the AEP.
An illustration of Customer Journey Analytics architecture
When it comes from Adobe Analytics, data is collected from web or app and is sent directly to an Adobe Analytics server where it is mapped into dimensions and events. This difference is vital to understand as it will also be important from a reporting perspective.
An illustration of Adobe Analytics architecture
Customization Another key difference is the level of customization. CJA offers a highly configurable platform, allowing businesses to tailor the analysis to their specific needs. This level of customization empowers organizations to create bespoke analytics solutions that align with their unique business objectives and KPIs. For instance, the derived fields feature in CJA. This can be compared to processing rules in Adobe Analytics but offers even more customization. With derived fields, the user can clean up data more easily, classify data and create more complex data manipulations. This can all be applied retroactively to the data which means that it will be applied to all the collected data and not just data collected after applying the logic.
In contrast, Adobe Analytics provides a comprehensive suite of pre-built features and reports, making it easier for users to start analyzing data without extensive customization. This out-of-the-box approach can be beneficial for organizations looking for quick and standardized analytics solutions.
Advanced Segmentation Additionally, Customer Journey Analytics offers advanced segmentation capabilities, enabling businesses to target specific customer groups based on their behavior and preferences. This granular level of segmentation allows companies to personalize their marketing efforts and create targeted campaigns that resonate with different customer segments. On the other hand, Adobe Analytics, although capable of segmenting data, places more emphasis on general website trends rather than individualized segmentation. This broader focus can be useful for organizations looking to understand overall website performance and trends across different user segments.
Benefits of Implementing Customer Journey Analytics Implementing Customer Journey Analytics brings several benefits to businesses. Firstly, it enables the organization to utilize the powerful technologies within the AEP. It provides a holistic view of the customer journey, enabling companies to identify pain points, bottlenecks, and areas of improvement across online/offline data sources. This knowledge empowers businesses to optimize their marketing campaigns, website experiences, and customer engagement strategies.
Furthermore, Customer Journey Analytics enables businesses to gain insights into highly engaged and potential prospects. By understanding the behavior, interests, and preferences of these prospects, companies can segment them and target them with tailored messaging and offerings. Advanced segments based on these 360-degree views of the user journey can be created and sent to the Adobe Experience Cloud to activate on these segments using other Adobe Products such as Journey Optimizer to leverage the value of the integrated tools. It is also possible to send these segments to other parties such as Google Ads, Meta etc.
Moreover, Customer Journey Analytics can also help businesses in predicting future trends and customer behavior. By analyzing historical data and patterns, companies can anticipate potential shifts in customer preferences and market demands. This proactive approach allows businesses to stay ahead of the competition and adapt their strategies, accordingly, ensuring long-term success.
Additionally, Customer Journey Analytics can be instrumental in improving customer retention and loyalty. By tracking customer interactions across various touchpoints, businesses can identify loyal customers and understand the factors that contribute to their satisfaction. This information can be used to create loyalty programs, personalized offers, and exceptional customer service experiences, fostering long-lasting relationships with customers.
Who Would be the User of Adobe Analytics and CJA? Adobe Analytics and Customer Journey Analytics have distinct user profiles. Adobe Analytics is commonly used by marketing professionals, web analysts, and digital marketers. Its intuitive interface and pre-built features make it accessible to users with varying levels of technical expertise.
Customer Journey Analytics, on the other hand, offers more advanced technical features. The level of customizable may appeal to users who require in-depth customer journey insights and tailored analysis. Nonetheless, given its user interface closely resembling Adobe Analytics, Customer Journey Analytics can offer value even to users who don't necessarily need highly customized reports but prioritize comprehensive insights into the customer journey. It retains familiar drag-and-drop functionalities and right-click options within the Analysis Workspace. Thus, transitioning from Adobe Analytics to Customer Journey Analytics wouldn't present a significant adjustment for users accustomed to working in the Analysis Workspace.
Before deciding which analytics tool to use, consider the following factors: 1. Data approach: Consider the variety of data sources that you need to analyze. If you need to capture and analyze the entire customer journey, Customer Journey Analytics might be the better choice. If you only need to analyze website traffic and engagement metrics, Adobe Analytics might be sufficient.
2. Architecture: Consider the technical requirements and resources needed for each tool. Customer Journey Analytics requires a connection to Adobe Experience Platform (AEP) and leverages its technologies, while Adobe Analytics is an analysis workspace built on top of an Adobe Analytics implementation. it's worth noting that while Adobe Analytics is optimized primarily for web and app tracking, it is indeed feasible to transmit data from alternative sources to Adobe Analytics. Yet, this process may not be as streamlined as it is when using CJA.
3. Customization: Consider the level of customization needed for your analysis. If you need more flexibility and control over your data, Customer Journey Analytics might be the better choice. If you only need to analyze website and/or app-related behavior and don't require as many on-the-fly data processing and customization abilities as CJA offers, Adobe Analytics might suffice.
4. User profiles: Consider the profiles of the users who will be working with the tool. Customer Journey Analytics might be more suitable for business analysts, data scientists, or marketing professionals who need a comprehensive view of the entire customer journey. Adobe Analytics might be more suitable for web analysts or digital marketers who simply need to analyze website traffic and engagement metrics.
5. Budget: Consider the cost of each tool and how it fits into your budget. Customer Journey Analytics is a more advanced and comprehensive tool, which comes with a higher price tag when migrating or setting it up. Adobe Analytics is a more affordable option, but may not provide the same level of insight and detail on every customer touchpoint as Customer Journey Analytics. Nonetheless, there are a lot of actionable insights that can be derived from using Adobe Analytics.
By considering these factors, you can make an informed decision on which tool to use for your data analysis needs.
Summary In conclusion, Customer Journey Analytics and Adobe Analytics are both powerful tools in the data analysis realm, but they have key differences. Customer Journey Analytics focuses on the entire customer journey, offers advanced customization and segmentation, and enables businesses to gain insights about highly engaged prospects. Adobe Analytics, on the other hand, primarily concentrates on website performance analysis, provides pre-built features, and targets a wider user based.
By understanding the strengths and characteristics of each tool, you can make informed decisions about which one best aligns with your specific requirements and goals. Whether it's optimizing the customer journey or analyzing website metrics, leveraging the right analytics tool can pave the way to data-driven success.
Are you just starting or looking to optimize your current operations?
We are happy to set up a quick, no-strings-attached chat to talk through potential CJA use cases and help you explore which path might make most sense in your case. Contact us here!
Who are we?
At Accrease, we bring data to life. Most companies track their customer's behavior on the website but don't understand the data they collect. We help ensure to gather relevant data, make sense of the data, and present it back to you in a simplified manner.
Overall, we help you make decisions based on data so that you can improve your business.