Many of the websites you use every day, for example Gmail, Facebook, or Twitter, can feel so seamless, fast and smooth. You click, and content just appears, without the whole page blinking and reloading. That's the magic of a Single Page Application (SPA)! These web experiences are designed for speed and fluidity, but they introduce unique challenges when it comes to personalization tools like Adobe Target.
In this post, Santosh Kumar, Principal Consultant at Accrease, shares two real-world challenges that we faced when implementing Target in an SPA, and how our team developed scalable solutions.
What's an SPA?
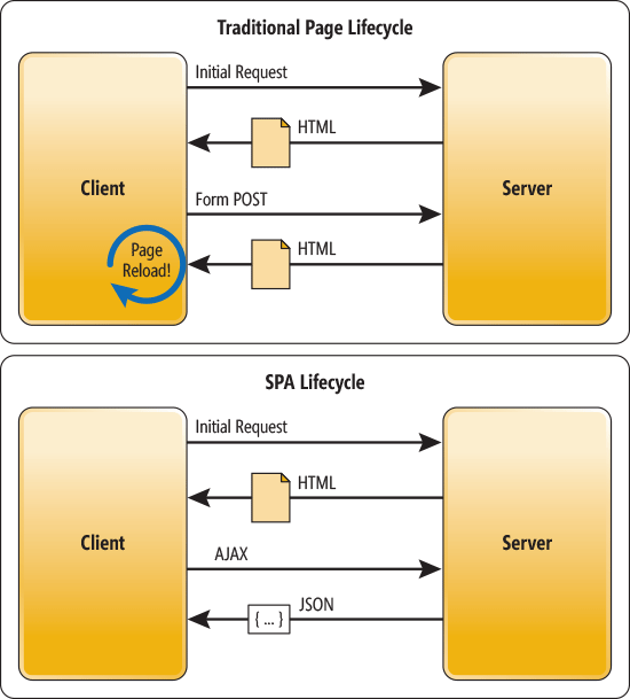
Imagine a website that's not a series of separate pages, but rather a single, smart canvas. When a user first visits, the browser loads the essential HTML, CSS, and JavaScript. After that, interactions update only the parts of the page that change, without reloading the full page.
Why are SPAs so popular and powerful today?
Faster performance: Because only small chunks of data are exchanged and rendered, SPAs feel incredibly quick and responsive. This results in a significantly faster user experience.
Smooth navigation: The absence of full-page reloads eliminates the jarring "white flash" and makes the navigation feel continuous and fluid, almost like using a native mobile application.
Enhanced Efficiency: With less data being transferred between the server and the client, SPAs reduce server load and bandwidth consumption, leading to more efficient performance overall.
Modern Development: Developers leverage powerful, cutting-edge JavaScript frameworks like React, Angular, and Vue.js to build SPAs, making the development process more organized and the applications more robust.
For the user, this means a fluid, modern web experience. But for personalization platforms like Adobe Target, it breaks the traditional pattern of reloading and re-evaluating content at each navigation.
The challenge with Adobe Target and SPAs
Adobe Target is a leading personalization and A/B testing tool that empowers businesses to deliver tailored content and experiences to their website visitors. It's all about showing the right message to the right person at the right time.
However, SPAs present a unique challenge for traditional personalization tools. Normally, when a user navigates to a new page, a "hard reload" occurs, and Adobe Target's main script (alloy.js, used for Adobe Web SDK) is re-executed, triggering a new "mbox call" to check for personalized content. In an SPA, this only happens on the very first page load. After that, all subsequent navigations are "soft reloads", dynamic content updates without a full page refresh. This means Target doesn't automatically get the signal it needs to re-evaluate and deliver new personalized experiences.
To address this, Adobe Target uses a concept called "views." A view is simply a named state or screen within your SPA. Think of it like a virtual page, even though the browser isn't actually reloading. For example, "homepage," "product-details," "shopping-cart," or "checkout" could all be defined as distinct views. When a user transitions to a new view, we manually tell Adobe Target, "Hey, the user is now on the 'product-details' view!" This manual trigger allows Target to deliver the appropriate personalized content for that specific screen, even without a full page reload.
Illustrating the "View" concept:
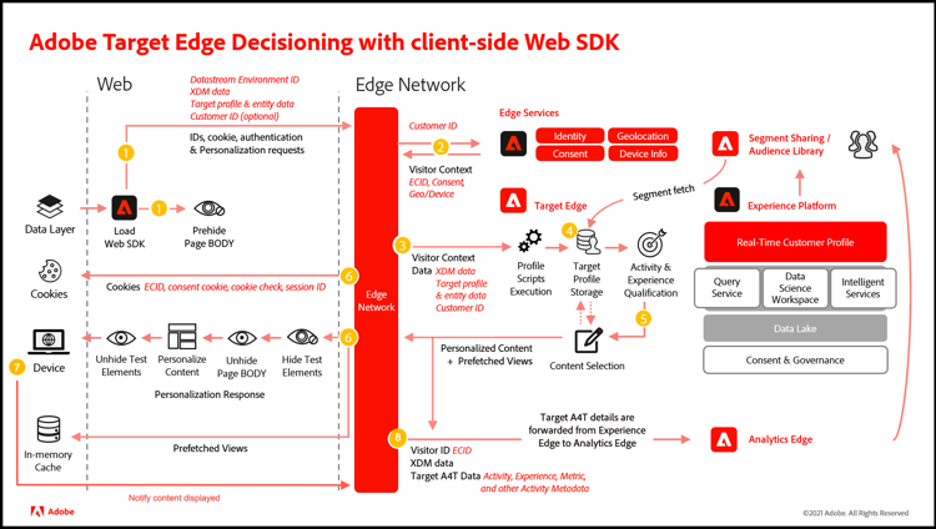
Picture from: Adobe Experience League.
Solving real-world scenarios with Adobe Target in SPAs
While the "views" concept is foundational, we encountered a couple of significant real-world challenges when trying to implement Adobe Target for more complex personalization scenarios in an SPA environment.
Challenge #1: Personalizing across thousands of similar pages (The "Marketer's Nightmare")
Take a large hotel booking site. It might have thousands of unique hotel detail pages, each representing a different property. In an SPA, each of these pages would typically have its own unique "view" name (e.g., "hotel-london-view," "hotel-paris-view," "hotel-tokyo-view"). Now, imagine a marketing team wants to change a small, universal piece of text, perhaps a call-to-action button or a promotional banner, that appears on every single one of these thousands of hotel detail pages. If they had to set up thousands of individual personalization rules in Adobe Target, one for each unique view name, it would be an incredibly time-consuming, impractical, and unscalable "marketer's nightmare."
Our approach: The generic view name trick
To solve this, making personalization scalable, we implemented a generic view strategy. Instead of sending unique view names for each individual hotel detail page, we sent a single, generic view name (e.g., "hotel-page" or "en: hotel page") for all hotel detail pages. This simple yet effective "trick" means marketers only have to set up one personalization rule in Adobe Target for the "hotel-page" view, and it automatically applies the desired change to all thousands of hotel pages. This dramatically simplifies campaign management and deployment.
Supporting marketers with our Accrease Custom Chrome Extension
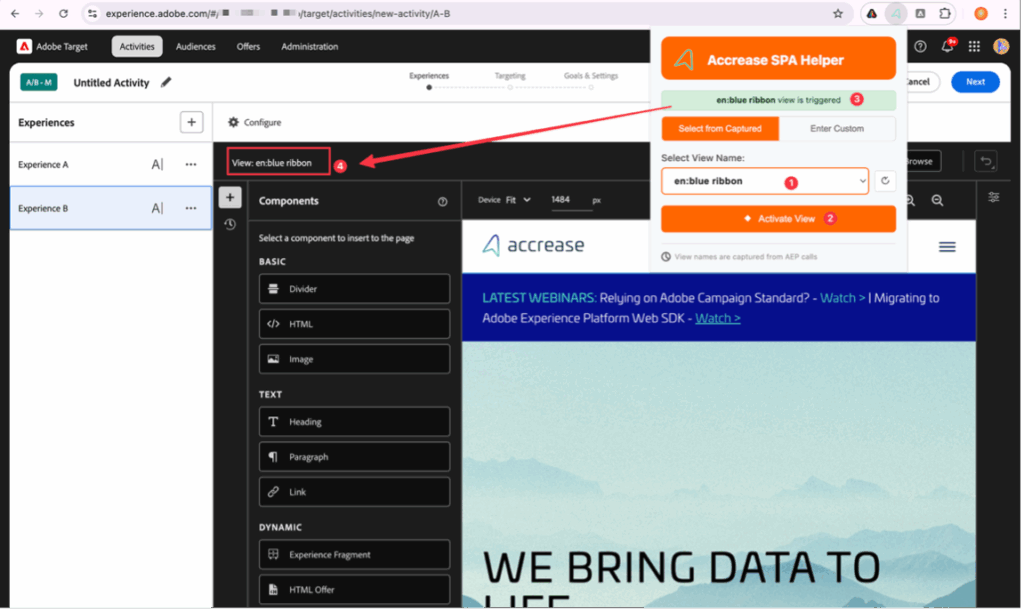
Even with a generic view name, Adobe Target’s Visual Experience Composer (VEC) can still be difficult to use in SPAs. The VEC often defaults to the most recent view triggered, which may not be the one marketers want to edit.
To solve this, we developed a custom Chrome extension! This tool is extremely helpful for marketers working with SPAs. It listens for all the "view" names triggered by alloy.js on a page and populates them into a simple dropdown list within the extension. Marketers open the extension, select the exact view they want to work with (such as "hotel-page"), click "Activate." Then that specific view becomes visible and editable in Adobe Target's VEC.
The extension also includes a custom text box, allowing marketers to manually enter and activate any view name, even if it hasn't been implemented in the tag manager yet. This is incredibly useful for planning and setting up campaigns in advance. This tool significantly reduces manual effort, improves efficiency, and accelerates campaign creation for SPA-based sites, particularly for marketers who may lack in-depth technical knowledge.
Here is a closer look at the extension:
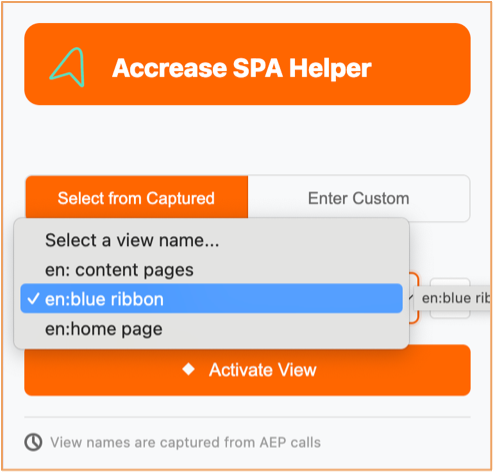
Here's a visual representation of how our Chrome extension “Accrease SPA Helper” helps:
Behind the extension:
Building such an extension may sound straightforward, but it requires both strong front-end development skills and a deep understanding of how Adobe Target operates. As Adobe Experience Cloud experts, we combined that knowledge with modern development tools to accelerate the process. AI-assisted coding helped us move faster, but it still took multiple iterations, testing, and refinement before we reached a polished and reliable solution. The end result is what you are seeing today, a tool that makes personalization in SPAs far more accessible for marketers, delivered with both speed and quality.
Challenge 2: Inaccurate goal tracking in A/B tests goal (The conversion discrepancy)
While personalization was now scalable, we noticed another issue: conversion tracking in Target wasn’t aligning with Adobe Analytics data.
For example, in an A/B test where the goal was a visit to the thank-you page, Analytics showed far more completions than Target.
The root cause:
After a thorough investigation, we pinpointed the problem. Since our site is an SPA, most users navigate between pages using "soft reloads." During these soft reloads, the main "mbox call" (which is crucial for Adobe Target to register user actions, evaluate goals, and track conversions) was not being sent automatically. Target was only recording a goal completion if a user happened to perform a full "hard reload" on the "thank you" page. This explained the small number of conversions we were seeing in Target compared to Analytics.
The fix:
We escalated this issue to Adobe Client Care, who involved their engineering team. After several rounds of analysis and communication, they confirmed our findings and recommended a crucial adjustment to our tag manager setup, specifically, the order in which Target calls were being fired.
Before (The problematic setup):
On Hard Reload:
- mbox call (decisionScope = __view__)
- view call 1
- view call 2
- view call 3
On Soft Reload:
- view call 1
- view call 2
- view call 3
(No mbox call here)
As you can see, the critical mbox call was absent on soft reloads, preventing Target from registering goal conversions.
After (The solution: Adobe's suggested Fix):
The fix involved ensuring the mbox call was always present, even on soft reloads, and crucially, fired after all view calls.
On Hard Reload:
- mbox call (decisionScope = __view__)
- view call 1
- view call 2
- view call 3
On Soft Reload:
- view call 1
- view call 2
- view call 3
- mbox call (decisionScope = __view__) ✅
By adding the mbox call at the end of soft reloads, Target is now able to evaluate goal conversions correctly, regardless of whether the user navigates via a hard or soft reload. This simple but vital change ensures accurate conversion tracking for all A/B tests.
What does this mean for marketers?
SPAs deliver the modern experiences users expect, but they also require rethinking how personalization and testing are implemented. Our work with clients has shown that:
- Scalability matters. Using generic view names transforms personalization from unmanageable to efficient.
- Ease of use is critical. Tools like the Accrease SPA Helper extension empower marketers to manage personalization without heavy technical support.
- Accuracy is non-negotiable. Ensuring conversions are tracked correctly builds trust in testing results and enables data-driven decisions.
At Accrease, we bridge the gap between technical implementation and marketer usability. The result is personalization that’s not only possible in SPAs, but also scalable, reliable, and effective.
SPAs are here to stay, and personalization tools must adapt. By rethinking view management and conversion tracking, our team at Accrease has helped clients work the full potential of Adobe Target in SPA environments.
If your organization is facing similar challenges, we’d be happy to share our approach and explore how to make personalization more scalable and marketer-friendly in your setup. Contact us here
Acknowledgements

About the Author
Santosh Kumar, has more than a decade of experience in Digital Marketing and the Adobe stack. He holds more Adobe certifications than is humanly possible. When no one else can fix it, you call for Santosh.
A special thanks to Kurian George for his support in investigating these challenges, co-developing solutions, and ensuring smooth implementation. His expertise was essential in making these results possible.