
The Adobe Analytics Component Manager by Datacroft is an essential tool for many organizations using Adobe Analytics.
Several of our clients use and benefit from Datacroft's Component Manager. It's a fantastic tool, so a shout-out to Lukas Oldenburg for his work on it.
I strongly recommend you check it out if you're not familiar with it already.
If you are familiar with it, you know it works in Google Sheets, which not all our clients are excited about for various reasons. This has got me thinking that it should be possible to use the Adobe Analytics APIs in Excel.

Kasper Andersen, Partner
Like everyone else, we at Accrease are investigating how we can better use AI internally, with our clients, and in our deliveries.
So, last week, I decided to see how far I could push AI as a developer on something I had yet to gain exposure to. I thought it would be a good project to see if I could integrate the Adobe APIs into Microsoft Excel.
I am by no means a developer. Javascript I can read, but I used to Google it if I needed to write. Nowadays, I GPT it— if that's even a thing?
I use chatGPT daily, from being my personal developer to checking my grammar and summarizing notes. Even talk with it when driving to and from work. I know, I really need to find some friends.
My initial thought was to have chatGPT support me in building an Excel add-on, but after explaining my requirements, it suggested using Office Scripts?!
What are office scripts?
I've had no previous exposure to Office Scripts, so if you're the same, let me give you a quick intro to them.
Office Scripts is a tool in Microsoft Excel that helps you automate repetitive tasks. It makes it easy for everyone to use, even if you don't know how to code. Excel even comes with some out-of-the-box scripts to make your life easier. You can either record an action for it or code it using TypeScript, which is basically JavaScript.
They are only available in Office 365, but you can share them across users and organizations.
Now, you might be thinking. What's the difference between Office Scripts and traditional Excel Macros? Office Scripts are newer and easier to use than older Excel macros. Macros use a language called VBA, but Office Scripts uses TypeScript/JavaScript. Office Scripts also work with the online version of Excel, making them more convenient for using different devices.
Whether I've piqued your interest or not, if you're working in Excel daily, you should do yourself a favor and watch a few YouTube videos on the topic.
The result
It took about a week—a lot of back-and-forth with chatGPT and tests in Postman (for the Analytics APIs) and copy-pasting the office scripts. Whenever Excel generated an error, I would paste the error message back into chatGPT, asking it to address the error and creating a new script.
Once I had a functioning script, I would ask chatGPT to optimize it without breaking its functionality, which often resulted in a much smaller script.
I'm pretty impressed by the results myself and how AI can function as a developer — I have no real previous experience with the APIs and certainly not with Office Scripts, and today, we have a spreadsheet that works both on the desktop and online version of Excel.
For now, the functionality is the following:
- Extract Workspaces: See usage and edit them straight in the spreadsheet.
- Extract users: See their activities broken down by 4 previous quarters.
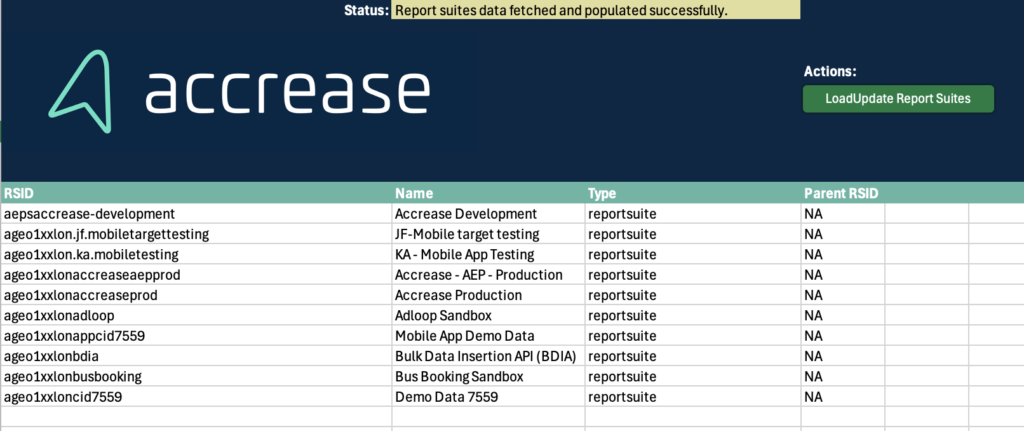
- Extract report suites: Provides an overview of your Report Suites and Virtual Report Suites.
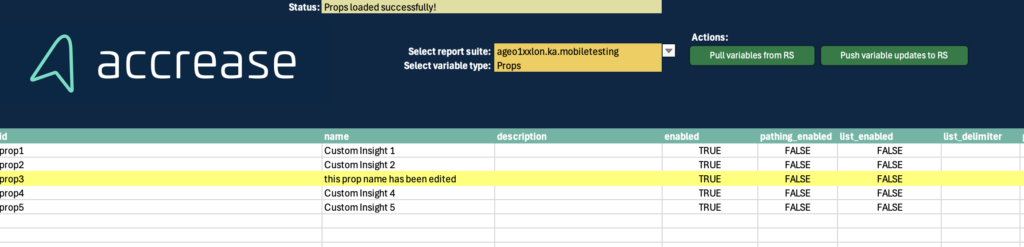
- Edit report suites: Allows editing/enabling/disabling variables in one report suite at a time.
Let's get you started
Enough talk; let's get your set up to take it for a spin.
1. Download the sheet
Start by downloading the sheet by filling out the form below:
2. Configure API connection
Once you have the sheet, the first step is to go to the config tab. You must fill out A11 (Client ID) and C11 (Access Token).
To get this information, you need to create a project on Adobe.io. Here are the high-level steps:
- Create a new project.
- Click add API.
- Select Adobe Analytics.
- Select OAuth Server-to-Server.
- Once the project is created you can find the credentials on the Project Overview page under Credentials.
- Copy and paste them into the cells, and click the button, Get OrgId.
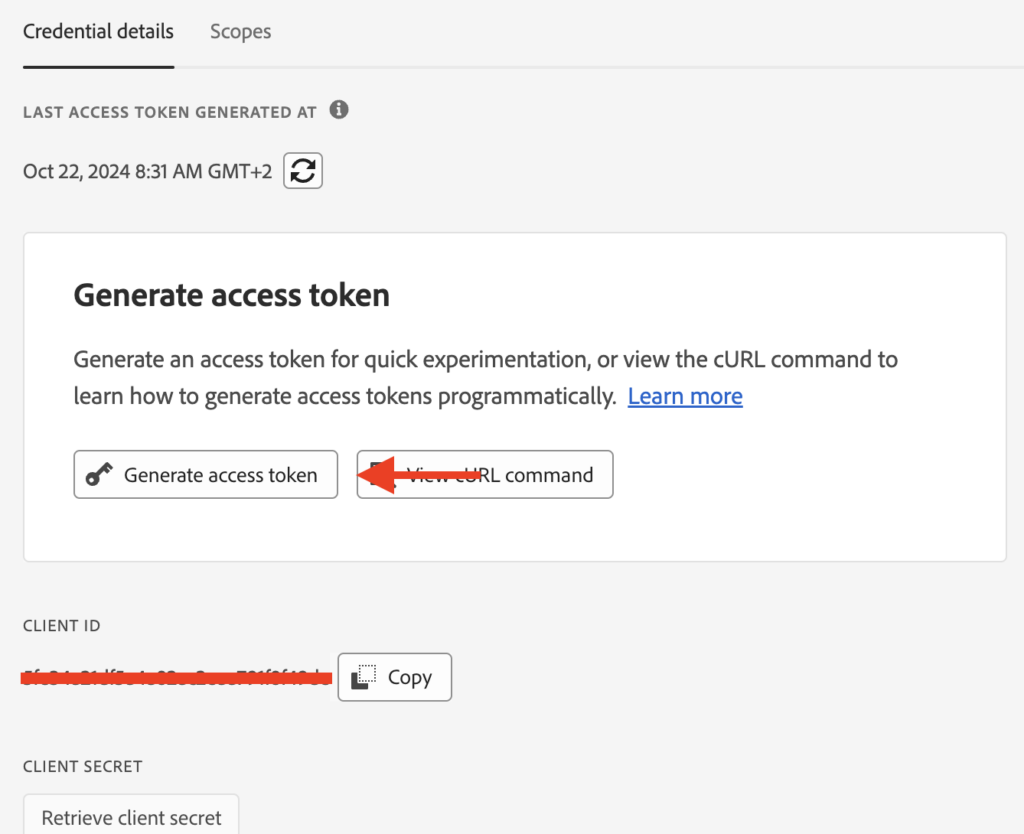
If successful, B11 will be populated with your Global Company ID, and you will be ready to use the other sheets.
IMPORTANT: Be aware that the sheet is not automatically getting the access token; why you just copied and pasted it. This also means that it expires after 24 hours. If that happens, you'll get an error when using the spreadsheet. All you have to do is go to your Project Overview > Credentials and click Generate new Access Token, which you copy and paste into the sheet again.
3. Start using the sheet
Hopefully, the buttons are self-explanatory. The Pull- buttons will extract and fill the sheet. You cannot mess anything up if you don't click the Push- buttons, as this will push changes back into Analytics. But let's quickly go through the sheets:
- Report Suite: Start here, as it functions as the source for the dropdown in the Report Suite Editor sheet. Other than that, it only has the purpose of giving you an overview of your report suites.
- Report Suite Editor: Select your report suites from the dropdown along with the variable type you wish to load. Click the pull button, and they will load. If you make any edits, the row will be highlighted in yellow - if you edit it back to its original value, it will still be highlighted. So, to 'reset' the sheet, you click the pull button again. Edits will populate the last column with a 'True.' Clicking the Push button will push all rows marked with True back into Adobe Analytics. After the push, you should click the Pull button to refresh and see your updates have been applied.
- Users: The purpose of this sheet is to provide an overview of the users and how often they log in. Besides giving a general overview over the past 4 quarters, it will also provide an overview of users who have not logged in the last 12 and 3 months. Please note: The user's list is pulled from within Adobe Analytics (Admin > Analytics Users & Assets). It will not correspond with the list of users from within the Product Profiles in the Admin Console.
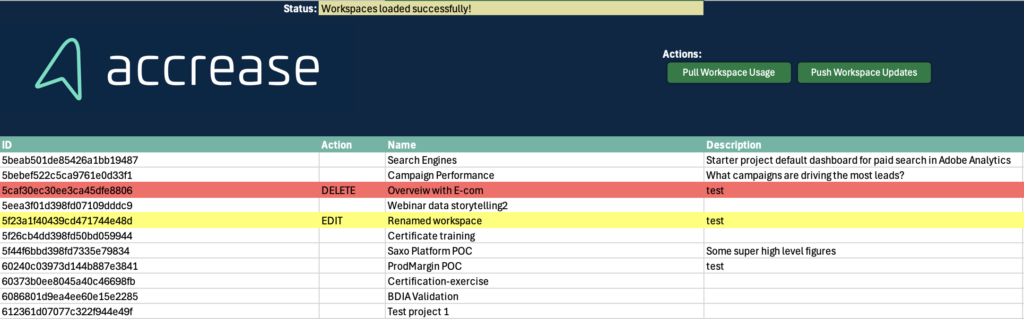
- Workspaces: This sheet allows you to pull all the workspaces in the account with all the details required to understand when it was created, which report suite it is used on, who created it, etc. You can delete and make edits to the workspaces.
If you edit details for a workspace, e.g., change its name, the row will be marked yellow, and column B (Action) will be pre-populated with EDIT.
If you want to delete a workspace, click the cell in column B (Action) and select DELETE. This will mark the row with red, indicating it will be deleted. If you remove the DELETE value or redo any edits to the original value, it will still be highlighted; you can pull data again to reset.
If you make any edits, the 'Action' column will have a value, and the rows will be highlighted in color. Based on this, the API will push updates for all workspaces with an EDIT or DELETE value set.
After the push, you should hit the pull button to see the updates to the Workspaces.
Final note
- You are responsible for using this tool, and Accrease is not liable for any outcomes resulting from its use.
- The sheet uses macros, which you should enable. Macros look for edits and highlight the row that is edited. I could not get this working with Office Scripts.
- Remember, it requires a work/school account with Microsoft 365, as Office Scripts are unavailable on personal accounts.
- Feel free to copy the Office Scripts if you can use them elsewhere.
I'd love to hear your thoughts!
Please comment below if you found this helpful or have suggestions for additional features. We'll continue to expand on the features based on the input we receive.